
When sales and marketing teams align well, they achieve greater profitability and better annual revenue growth. Creating a solid partnership between sales and marketing requires a strategic approach that treats the two teams as critical partners in achieving a single revenue-generating goal.
The key to alignment is implementing a framework of communication, data-driven tools, and processes that help sales and marketing teams work better together. Once expectations are set and the KPIs are clearly defined, everyone can begin to work in lockstep to reach the goal.
This article examines the five key elements of the sales and marketing alignment framework in depth so that you can achieve better results from your sales and marketing investment.
Table of Contents
- Closed-Loop Reporting Requirements
- Defined Funnel Stages
- Understand Lead Quality
- Lead Qualification Matrix
- Examples of the Lead Qualification Matrix
- Develop Your Definition of an MQL
- Create A Lead Scoring System
- Service-Level Agreement (SLA)
- Dashboards & Reporting
- Sales and Marketing Communication
Conclusion & Additional Resources
1. Closed-Loop Reporting Requirements
 Data is the crucial ingredient for maintaining sales and marketing alignment. You need data to monitor progress toward goals, analyze lead quality, and measure sales and marketing ROI.
Closed-loop data provides a holistic view of the entire customer journey that allows business leaders to:
- See which approach to new customer acquisition delivers the best bang for your buck.
- Continually optimize alignment between the business objectives and customer experience, creating better outcomes for everyone.
The two key pieces of a closed-loop reporting system are:
- Marketing Software: Marketing software that helps you with lead generation and management.
- CRM (Customer Relationship Management): A CRM system that helps you track and measure sales activities.
Requirement 1: Integrated Marketing and Sales Software
Your marketing and sales systems contain the people who have agreed to do business with you, whom you want to do business with or other important business contacts. They must be integrated to share data on the entire buyer's journey, tracking every lead from creation to an opportunity to close. The days of isolated data spread around marketing software, sales software, accounting software, and spreadsheets are over.
Every company is unique in the software and processes they choose to run their sales and marketing campaigns. Still, the end goal is a central data repository for all prospect and customer contact and company data you collect over the life of the business.
Prospects and customers are your business, so the interaction with your company should be exactly what they want and need. It begins with organized and maintained data so sellers, marketers, and service teams can communicate effectively.
Requirement 2: Information Sharing
Marketing and sales teams communicate with the same people but in different ways. Marketing tracks the digital experience, and sales tracks personal outreach and real conversations. Working together, the two teams can create an optimized customer experience.
What should marketing share with sales?
- Complete Lead Intelligence: the history of each lead’s activity on your website, including campaign engagement, download history, and social media presence. Including these details in each lead record helps sales reps plan their follow-up strategies and find hooks to start that first conversation.
- Lead Alerts: Lead alerts are email messages or other notifications sent when a particularly hot lead visits your website, responds to an important campaign or takes another trigger action (such as requesting to speak with a salesperson).
What should sales share with marketing?
- Contact Touches: Records of email and call attempts and connects.
- Sales Funnel Stages: Updates on who's qualified and where they are in the decision-making process.
- Revenue Numbers: Data on in-progress and closed deals and the revenue associated with each contract to calculate effectiveness and ROI.
Requirement 3: Lead Tracking Process
Trace each customer back to the source of their first visit to your website—e.g., Paid Search, Organic Search, Social Media, or Email Marketing. You can also analyze each channel for other key metrics, such as visits per channel, leads per channel, visit-to-lead ratio per channel, and lead-to-customer ratio per channel.
Examine the lead history of each customer and record every marketing touch and action that occurred between lead capture and close. By calculating the percentage of customers who visited a specific page on your site prior to conversion or who viewed a particular webinar or white paper, you can see which of your content was most effective in your marketing funnel.
This process can also include reviewing specific market campaigns to determine which generated the most leads and customers. You can also examine which of your campaign landing pages generated higher-than-average conversions. The insights you gain from these reports help you fine-tune your content strategy or optimize your site to promote more influential pages.
Use this data to optimize your marketing mix and focus on the channels that are delivering the best conversion metrics.
2. Defined Funnel Stages
 Sales and marketing teams often have very different views of the funnel. They might disagree about the number of stages a lead passes through before becoming a customer, and they often use different terminology to describe those stages.
To adopt an alignment strategy, sales and marketing must have a unified picture of the funnel and standard definitions of each stage in the process. Here is an example of funnel stages.
Understand Lead Quality
Focus on the definition of a Marketing Qualified Lead (MQL). This is the crucial hand-off point between marketing and sales, so it’s essential that the teams agree on the terminology.
Every company’s definition of an MQL will vary, but it should reflect a combination of traits and actions that indicate a lead is both a good fit for your company and ready to talk to a salesperson. Here’s an example of how to examine your funnel to assess lead quality and determine whether a lead is ready for sales follow-up:
1. Is the Lead a Good Fit?
Your company might target financial services companies with 5,000 or more employees or small service businesses with fewer than 100 employees. Or, you may be only interested in manufacturing companies of any size. Within those categories, you also might identify individual lead profiles, such as title or job description and role in the decision-making process – e.g., economic buyer, end user, influencer. How closely a lead adheres to your ideal customer profile will determine whether and when you hand it over to the sales team.
2. Is the Lead Interested?
A lead’s activity can reveal how close they are to a buying decision. For example, if a lead has only visited your website once or has just begun following you on Twitter, they may be aware of your company but are not particularly engaged. However, a lead requesting a demo or viewing pricing information is showing much more interest.
Lead Qualification Matrix
Where a lead falls within the four quadrants of the lead qualification matrix dictates your marketing or sales team's next step.

Examples of the Lead Qualification Matrix
 |
Good Fit & Interested Leads in the upper right quadrant are a good fit for your company and are highly engaged with your marketing. These are hot leads that require immediate follow-up from your sales team – usually in less than 24 hours. |
 |
Good Fit But Less Interest Leads in the upper left quadrant are a good fit for your company but don’t show a lot of interest yet. Perhaps they’ve only signed up for an email newsletter or downloaded one piece of educational content. These are leads that the marketing team needs to nurture. |
 |
Lots Of Interest but Not a Good Fit The leads in the lower right don’t necessarily fit your ideal customer profile but are highly engaged with your brand. They might have subscribed to your blog and email newsletter, downloaded your ebooks, and attended your webinars. It’s worth having a sales rep follow up with these fans at a low cost to see if there’s an easy sale to make from a non-traditional customer. Sometimes, leads that don’t seem like a fit have a good reason to buy your product. They can also turn into great evangelists for your products or services, thus providing you with indirect support as non-customers. That’s why you can’t automate the entire sales and marketing process. At some point, a good marketer or sales rep can spot an opportunity that your systems might overlook. |
 |
Little Interest & No Fit Leads in the lower left quadrant aren’t a good fit for your company and haven’t shown much interest in your marketing content. They’re definitely not worth a sales rep’s time. Don’t be afraid to remove them from your communication stream. By having a clean list of more engaged subscribers, your email and social messages will get better results. |
Develop Your Definition of an MQL
Using this matrix as your guide, develop a Marketing Qualified Lead (MQL) definition based on the combination of fit and interest that’s right for your company. Some marketers may focus more on fit because they have a tightly defined market; other marketers may have a broad customer base and focus more on interest level. That decision depends on your business model.
MQL definitions in those two cases might look like this:
- A contact with the right title or role who has filled out a landing page form and works at a financial services company in the United States with more than 5,000 employees.
- A contact with the right title or role at any U.S.-based company that has requested a product demonstration from a sales rep.
Whichever approach you choose, base your definitions on data, not gut instinct. Even experienced marketers and salespeople can be way off base in their assumptions about what makes a good lead.
Create A Lead Scoring System
Using a lead scoring or lead grading program that relies on data from your closed-loop analysis can help you determine the importance of different activities.
Here Are Some Common Criteria That Can Help You Develop a Lead Score:
- Examine Behavioral History: Examine the activity history of recent customers and analyze how many actions they took before becoming a customer – i.e., the number of page views or number of conversions, such as downloading a white paper or registering for a webinar, etc.
- Find Patterns: Look for patterns that indicate a lead’s likelihood of closing. For example, if a lead that downloads 10 pieces of content from your website or visits your site more than 15 times in one month is more likely to close, you can incorporate those frequency measures in your MQL definition.
- List Activities: Also, list all the activities a lead can take before becoming a customer and analyze the close rate for each. For example, to determine the close rate for a webinar, look at all customers who had watched it, then divide that number by the total number of leads who originally registered for it. That gives you the close rate for leads from that particular event.
- Calculate Close Rates: Using the close rates for individual actions, calculate the average close rate for all your marketing activities. Then, look for actions with a significantly higher close rate. For example, if your average close rate is around 1%, you might find a handful of actions with a 3%- 5% close rate.
Add these top-closing events to your definition of an MQL. Any lead that engages in at least one of these activities and is a good fit for your company would be considered an MQL. Also, use those close rates to decide what score to give to different activities in your lead scoring or lead grading system.
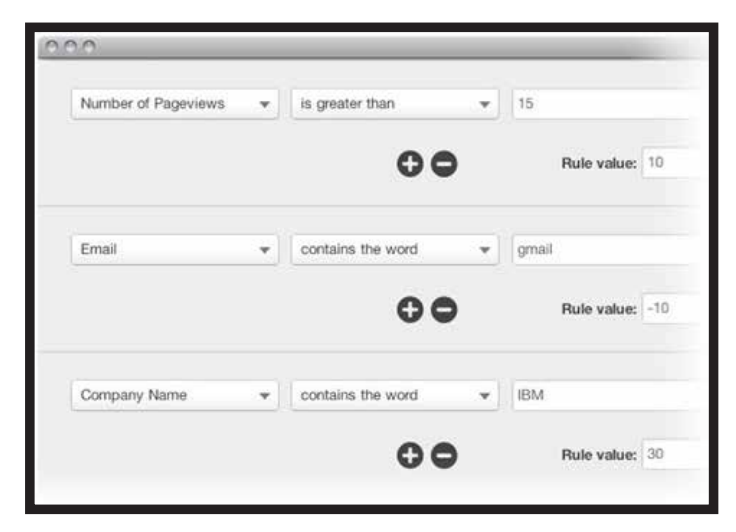
Here is an example of how to create a lead-scoring system using marketing automation technology:
3. Service-Level Agreement (SLA)
The MQL definition is the centerpiece of another critical alignment strategy: Implementing a service-level agreement (SLA) between sales and marketing.
The SLA formalizes the commitment that the sales and marketing teams make to meet shared revenue growth goals. It’s a two-way process: The marketing team commits to delivering a certain quantity and quality of leads each month to help the sales team meet its quota. The sales team then commits to following up on those leads in a timely manner and making a specific number of contact attempts before abandoning the lead.
To set up the SLA for the marketing team, start by asking these questions:
- How many quality leads does the sales team need to make quota?
- What percentage of those leads is originated by marketing? Your sales team may be doing some of its own prospecting, so the marketing team isn’t responsible for 100% of the leads needed to make quota.
- What percentage of those leads is influenced by marketing? Even if the leads originate from another source, the marketing team may be required to nurture those leads until they are marketing-qualified.
Once you’ve answered those questions for your company, compute the SLA based on the percentage of the pipeline that the marketing team needs to drive. But here’s a tip to make the SLA even more convincing for your sales team: Base the SLA in the units that are most relevant to a salesperson – dollar figures.
The service-level agreement (SLA) is a two-way process between sales and marketing.
How to Calculate SLA in Dollar Value
To calculate an SLA in dollars, take the percentage of the sales quota that marketing is responsible for each month – e.g., $200,000. Then, calculate the value of each MQL to determine how many leads marketing must deliver to reach that total. Here is how to calculate the value of an MQL:
- Create a list of all the different campaigns or offers that have generated leads in your pipeline, such as white paper registrations, demo sign-ups, and trade shows. You can also segment your leads by type of customer, such as enterprise vs. mid-sized and small businesses.
- Pull a list of recent customers and match them to the campaign or offer that generated their first visit or conversion. Then, calculate the average revenue per customer for each lead source. (If you’re segmenting by customer type, you can also calculate the average revenue per large vs. mid-sized or small customer.)
- Look at the average close rate for each campaign or offer. Then, multiply the average revenue per customer for those campaigns/offers against the close rate to determine the average MQL value.
For example, if the average revenue per customer from a lead that converted on a whitepaper is $160,000 and the average close rate on those leads is 1%, the value for each whitepaper MQL is $1,600.

Based on those figures, you can establish an SLA might look like this:
Marketing Will Deliver XYZ worth of MQLs per Month
To set up the SLA for the sales team, start by figuring out how quickly a sales rep should follow up on a new MQL.
How many contact attempts should the sales team make for every MQL of a certain type? How many follow-up attempts per lead should the sales team be able to complete each month?
Base Every Decision on Real Data
Once again, it’s important to use data to determine the sales team’s responsibilities. Take the question about the ideal number of contact attempts: Even though your chances of a successful connection increase each time you call a lead, those calls also have a cost associated with them: the sales rep’s time. At some point, the potential return for making additional calls will diminish.
That’s why you need to determine the optimal number of times to call a lead based on the profitability of that activity. Here’s one way to find that optimal number:
- Start With Stale Leads: Select a portion of leads that have been in the sales pipeline for at least a few months.
- Group Data: Look at your CRM records to determine how many times the sales team attempted to contact each of those leads before closing. Create cohorts of leads that were contacted once, twice, three times, four times, etc.
- Make Estimates: Estimate how much each contact attempt costs your sales team. You can do this by estimating how many hours a month a rep spends making calls and the average number of contact attempts he or she can make each hour. Then, determine the cost-per-call by dividing the average hourly cost of a sales rep’s time by the average number of calls per hour.
- Benchmark: Benchmark the profitability of these contact efforts by dividing the average revenue for each customer by the cost of calling a lead once, twice, three times, etc.
- Plot Data: Plot that data in a chart that uses the number of contact attempts as the X axis and the profitability score as the Y axis. Because additional contact attempts tend to generate more sales, you should see a line that gradually rises in profitability with the number of attempts.
- Note Results: Note where the lines level off – meaning the profit-per-customer isn’t increasing despite the additional contact attempts. This leveling-off point is the recommended number of contact attempts to use in your SLA.
Here’s an example of this type of analysis created by a Vice President of Sales. The colored lines represent the results for different types of leads in the HubSpot sales funnel. As you can see, the benefits of additional contact attempts tend to level off around eight or nine contact attempts:

Based on those results, the sales SLA might require sales to make one follow-up attempt within four hours and eight attempts in 14 days. Put the SLA rules about contact times and follow-up attempts in your CRM system to remind the sales team of their responsibilities.
4. Dashboards & Reporting
After implementing the SLA, use the data from your closed-loop reporting system to track progress towards those goals. Failing to monitor progress is a common mistake made by companies with poor alignment between sales and marketing – and it can be costly. If you’re not keeping an eye on your goals, you’re less likely to spot areas of concern until they spiral into big problems. It may be too late to do anything about it at that point.
Manage your sales and marketing alignment with these two valuable tools:
- Daily Dashboards
- Detailed Monthly Reports Of Sales and Marketing Activity
Failing to monitor progress is a common mistake - and it can be costly.
Dashboards
Sales and marketing dashboards turn data from your closed-loop reporting system into a daily snapshot of the team’s progress. Dashboards should be shared with the entire team by building them into your CRM system, incorporating them into your marketing software platform, or emailing them to the entire team.
This highly public update not only tracks your progress toward goals but can also help your team meet their goals. Marketers and salespeople are less likely to fall behind if they know that the rest of the team will see their numbers every day. And if people do fall behind, they’re more motivated to fix problems on their own.

The Marketing Dashboard
This Marketing Dashboard, also known as the Daily Leads Waterfall Graph, is a simple but very effective way to visualize your marketing team’s progress toward its SLA goals. The graph compares your daily lead flow against the target rate you need to hit your monthly goals.
Enter your results every day to plot your progress against the SLA goal. The resulting chart can show you where to focus your marketing team’s attention.
 |
If Leads Are Low If actual leads are below the goal, your marketing team must do additional work to deliver on its SLA promises. That might mean developing new content, increasing social media engagement, or spending additional money on PPC or other channels. |
 |
If Leads Are On Track If actual leads are running above the goal, your marketing team has some breathing room and can look ahead to the next month or next quarter. For example, you could start working on next month’s campaigns or hold back a few pieces of content for next month’s promotions. |
Sales Dashboards
Sales dashboards generally measure follow-up timing and contact attempts. Have your sales manager dig into CRM data to create charts illustrating whether the sales team delivers on its SLA goals. Two key dashboards are:
- New leads that were not called within XYZ hours, as specified in the SLA
- All leads that weren’t called at least XYZ times within XYZ days
These daily reports will show when specific teams or individual sales reps are falling behind on their goals. That early warning gives sales managers the chance to intervene, diagnose the problem, and provide coaching to help the team or the individual get back on track.

Monthly Reports
Dashboards provide a daily update of the most important metrics for your team. But you should also create a monthly sales and marketing report that gives a detailed look at your sales and marketing strategies and results.
This monthly report should be shared with the entire company. It creates transparency about sales and marketing activities and highlights how your efforts impact the entire business. The monthly report should feature charts that quantify the work that sales and marketing do each day.
Marketing Monthly Report
The marketing team’s report should illustrate the impact of its recent activities, including some of the following charts.
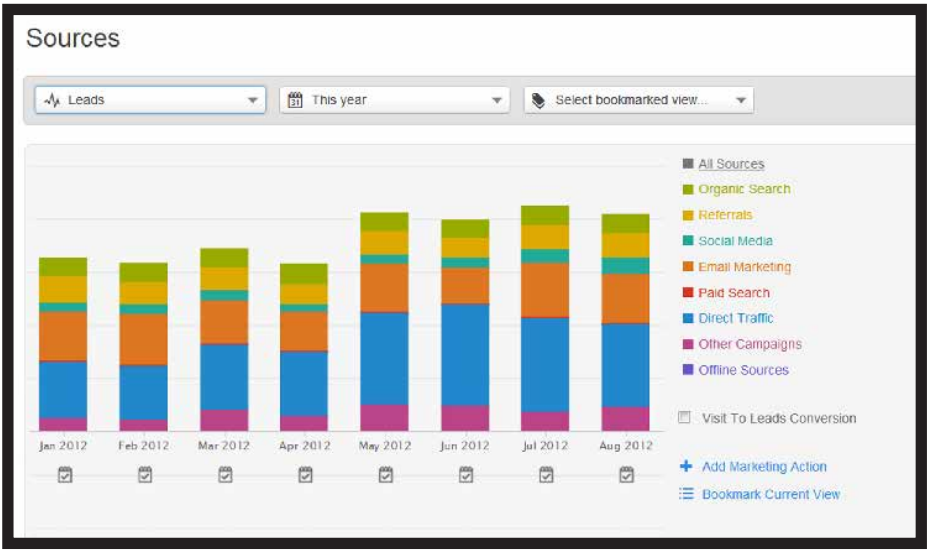
- Visits, Leads and Customers by Source: Show how your different marketing channels have helped you attract visits, leads and customers. Compare the contributions of organic search, paid initiatives, email marketing, referrals and social media, and evaluate which ones provide the most return on investment. Such insights will help you prioritize efforts in the future. Here is an example of how a Source report looks:

- Performance of Marketing Assets: Next, look at how your marketing assets-web pages, landing pages, and calls-to-action--are performing. These are the assets your various marketing channels use to succeed. In fact, they are the substance of what your sources use to generate more traffic, leads and customers. In order to evaluate how these assets are performing on a monthly basis, review the conversion rates of your landing page and calls to action.
- Speed from Conversion Event to Sales Follow-up: If you are a B2B marketer, you should also know how long a salesperson takes to follow up with a lead. That will give you an idea of how to speed up the “demo worked” process by creating more high-quality leads and/or ensuring that your sales team contacts the leads fast enough. Here is what that chart might look like:

Sales Monthly Reporting
The sales team’s monthly report should feature charts showing what’s being done with the leads generated by marketing.
- Sales Waterfall Chart: The most important chart to look at is a visualization of actual sales results vs. quota. The chart should show the percentage of the goal that was reached and if there was a gap between the quotas and the monthly goal. Here is what this chart can look like:

- Total Sales Cycle: It’s also important to keep track of how long your sales organization takes to convert the leads that marketing generates into customers. Monitoring this view will give you a sense of your sales cycle and if you are ever below or above average.
Whenever you engage in nonstandard marketing initiatives, keep a close eye on this chart. It will give you insights into the performance of your efforts from a sales perspective. This view is also tremendously helpful when you slice it across different target personas. You are probably targeting customers with different needs and preferences, and you might notice that their sales cycles are drastically different.

5. Sales And Marketing Communication
Another way to get sales and marketing to think like one team is to let those two groups interact in person. Regular meetings between the two groups foster communication and collaboration and help sales and marketing managers improve their tactics.
You should hold two types of meetings:
- Weekly Sales and Marketing Meetings
- A Monthly Management Meeting
It’s important to remember that meetings are not the only way to keep communication flowing between the two teams. Regular updates via email or other media can also be part of the collaboration process.
Regular meetings foster communication and collaboration.
Weekly Sales and Marketing Meeting
Get the entire team together at least once a week to discuss recent results and upcoming activities. The format of this weekly meeting will depend on the size of your organization. For a company with only a handful of sales and marketing staffers, it can be a highly interactive session, welcoming discussion and questions from anyone in the group.
But for a larger company with dozens of marketing and sales staff, the meeting should be a fast-paced, high-level overview to keep sales and marketing teams on the same page and moving toward the SLA goals.
Tips for Running Meetings
- Keep It Short: It’ll be best if you can keep meetings short and to the point. Try to keep them to 30-40 minutes. Just make sure they don’t go over an hour.
- Pick Timing Carefully: Hold it at the end of the day to avoid disrupting the sales team’s prime calling time.
- Pick Presenters: Designate one presenter each from Sales and Marketing to deliver their half of the update. That update should include the current status of SLA goals, plans for upcoming activities, recent highlights or big wins, and so on.
Think of it more as a performance than a dry presentation of charts and metrics. Look for presenters who can entertain and energize the group while quickly conveying the most important quantitative details.
Monthly Management Meetings
The monthly management meeting is an opportunity to examine results, discuss upcoming plans, ask strategy questions, and discuss any potential problems that may be causing your sales and marketing teams to drift apart.
Invite three to five key managers from the sales and marketing teams to the monthly meeting and empower them to work on the issues that affect sales and marketing alignment. In this way, they will forge solid relationships that will help your company grow.
Agenda items for the monthly management meeting include:- Review of Metrics: Detailed discussion of closed-loop analysis reports and current funnel metrics so sales and marketing can address any issues related to meeting the requirements of the SLA.
- Future Plans: Share plans for future marketing or sales projects and discuss potential strategy changes.
- Discussion Items: Resolving disputes between sales and marketing about lead quality or quantity, sales follow-up efforts, the definition of the MQL, or any other important terminology or practices.
Other Sales and Marketing Communication
Even with an SLA in place and dashboards and meetings to provide regular updates, marketers still might need other ways to show the sales team how their efforts are helping achieve revenue goals. In other words, marketers should think about the sales team as another customer base and try to “market” the role of marketing to that internal audience.
Weekly Reports
Here are some other ways you can foster collaboration between the two groups. Consolidate the information you need to convey to the sales team into simple, weekly newsletter-style reports intended to help them do their job. Here is an example of two weekly reports:
- Weekly Marketing Update: Weekly marketing updates can consist of a list of weekly planned promotions with short soundbites. This information helps the sales team understand where new leads are coming from so they can prepare for those contacts.
- Weekly Product Update: If your product or service changes often, consider informing your sales team about these changes. Send these weekly email updates from your email marketing platform so you can track open and clickthrough rates (CTR). You’ll see which sales reps are reading the updates and who is ignoring them. And if you notice overall opens and CTR declining, you know it’s time to refresh the newsletter format or tweak the information you’re sharing to make the report more valuable to the sales team.
Reshuffle Desks
Finally, you can encourage better communication within your team by mixing sales and marketing desks together. By sitting next to each other, marketers see firsthand how salespeople do their jobs – and whether marketing activities are helping them. Sales reps benefit by having a neighbor they can contact with questions about particular leads or new marketing campaigns. These informal conversations go a long way toward keeping the entire team happy and productive.
Conclusion and Additional Resources
One of the best things about this sales and marketing alignment framework is that it’s scalable. You can tweak elements such as your SLA or the definition of a marketing-qualified lead to reflect inevitable changes in your sales and marketing strategy as your company grows.
Always look for opportunities to modify the core elements of your strategy. For instance, you can develop new reports or filters to generate actionable data that helps your sales and marketing teams. You can also adapt your funnel description and MQL definition to reflect changes in your marketing strategy, customer base, and products or services.
You can revise your SLA to reflect changes in market conditions, customer needs, or the size of the sales staff and marketing staff to ensure that goals are realistic but aggressive enough to drive revenue and profit growth.
You can also adjust the format of your weekly meeting to fit your organization's size. If your company grows significantly, you can invite new managers or other key personnel to the monthly management meeting.
Ideally, tracking closed-loop data and holding monthly management meetings will uncover evidence of a growing disconnect between sales and marketing before the system breaks down completely. As you get more comfortable using data to manage your sales and marketing team, you’ll find new ways to optimize your campaigns, improve your sales follow-up, and generate more revenue – which is the best way to keep everyone in the company happy.
Comments